The Japanese yen extended its weakness into Thursday as a firm risk-on tone lifted major currencies and global equity futures. NZD and AUD outperformed, USD/JPY held a pivotal support zone, and the Nikkei 225 continued to shadow yen weakness as it hovered near the 50,000 level. With bullish signals appearing across several yen crosses and volatility seasonally low ahead of Thanksgiving, the next directional move hinges on whether sentiment can stay buoyant into week’s end.
View related analysis:
- USD/JPY Probes Support as US Dollar Stumbles on Fed Cut Bets
- Thanksgiving Market Seasonality: US Dollar, EUR/USD and Gold
- Nasdaq 100 Leads Wall Street, Meta Bounce Gains Traction
- Nasdaq 100 Outlook: Thanksgiving Seasonality and Volatility Trends
Yen Outlook: Weakness Persists as Global Risk Appetite Improves
New Zealand Dollar Surges After RBNZ Signals End of Easing Cycle
The New Zealand dollar was the strongest FX major on Thursday after the Reserve Bank of New Zealand (RBNZ) signalled the end of their easing cycle. They delivered the well-telegraphed 25bp cut, though cited concerns of rising inflation. NZD/USD rose 1.4% during its best day in seven months, NZD/JPY closed to its highest level since January amid a weak Japanese yen environment.
Australian Inflation Re-Accelerates, RBA Cuts Priced Out
Australia’s CPI came in hot which further vindicates the Reserve Bank of Australia (RBA) for inaction amid cried for further cuts. The monthly gauge of annual trimmed mean inflation rose to a 10-month high of 2.8%, CPI less volatile items and travel is now at 3.7% while weighted and broad CPI is at 3.5% y/y. Rate cuts have been effectively priced out of the RBA cash rate futures curve, with odds of a hike from Q3 2026 creeping higher into 2027. AUD/USD rose 0.7% during its best day in three months.
Yen Crosses Strengthen as Risk-On Tone Builds

Chart analysis by Matt Simpson - data source: Tradingview
Wall Street rose for a fourth day heading into Thanksgiving, and the risk-on tone left the yen as the weakest major currency. This opens the door for further upside across several yen crosses if sentiment remains buoyant.
- AUD/JPY formed a bullish engulfing candle above its 20-day EMA and closed back above the 10-day EMA. A move towards 103 now looks plausible.
- CHF/JPY printed a bullish engulfing day at its 20-day EMA and appears poised to retest cycle highs. A break above 196 assumes continued trend strength at record levels.
- EUR/JPY bounced cleanly from its 10-day EMA and is edging closer to its cycle high, with a break above the 182 handle implied.
- CAD/JPY formed a bullish engulfing candle between the 10 and 20-day EMAs and prior highs around 110.64, putting a run towards 112 on the radar for bulls.

USD/JPY Technical Analysis: US Dollar vs Japanese Yen
I outlined the importance of the February high at 155.89 as a potential pivotal level yesterday, and so far it is holding as support. USD/JPY printed its most bullish candle in five sessions around this level, forming a two-bar bullish reversal (bullish piercing line) and hinting at a swing low around the 10-day EMA.
However, volatility is likely to be low today as we head into Thanksgiving in the US. Using data since 1992, the average range for USD/JPY on Thanksgiving Day is just 0.55%, with a median of 0.44% — making it the least volatile session across the three days either side of the holiday. Average and median returns are slightly negative (but effectively flat) at -0.01% and -0.03%.
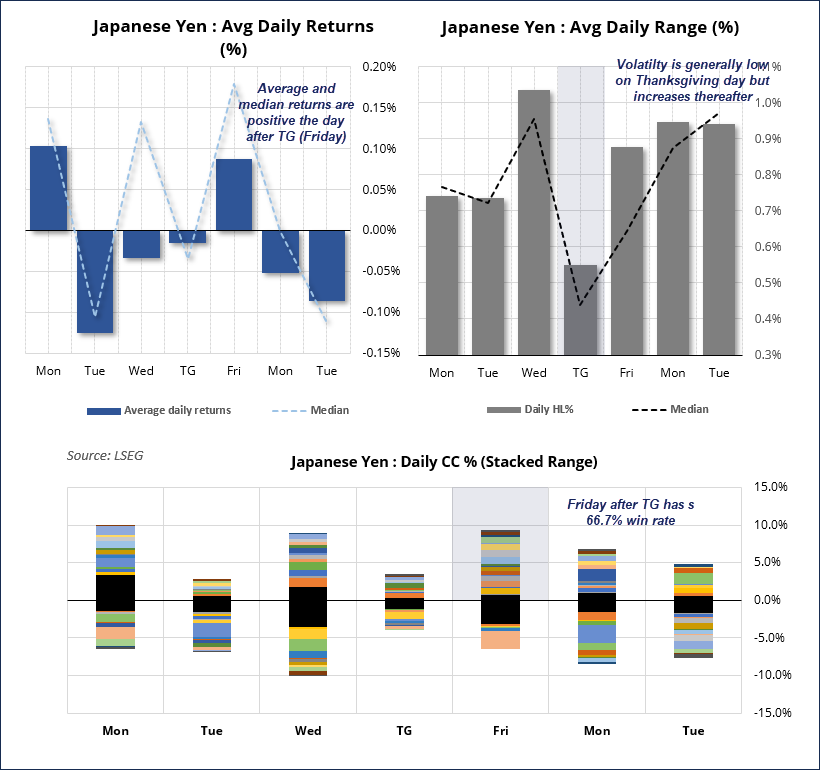
Chart analysis by Matt Simpson - data source: LSEG
The Friday after Thanksgiving shows an average return of 0.09% and a median of 0.18%, with the highest win rate of the seven days monitored at 66.7%.
So we could be in for a quiet session today, with the potential for a retracement within Wednesday’s range before bulls re-emerge tomorrow if the seasonal Thanksgiving pattern plays out.
- A break beneath Wednesday’s low (155.65) assumes a deeper pullback to the 155 area, near the weekly VPOC and 20-day EMA.
- If prices can build a higher low within Wednesday’s range, bulls can target the 156.80 HVN and 157.19 high – a break above which assumes a retest of the cycle highs.
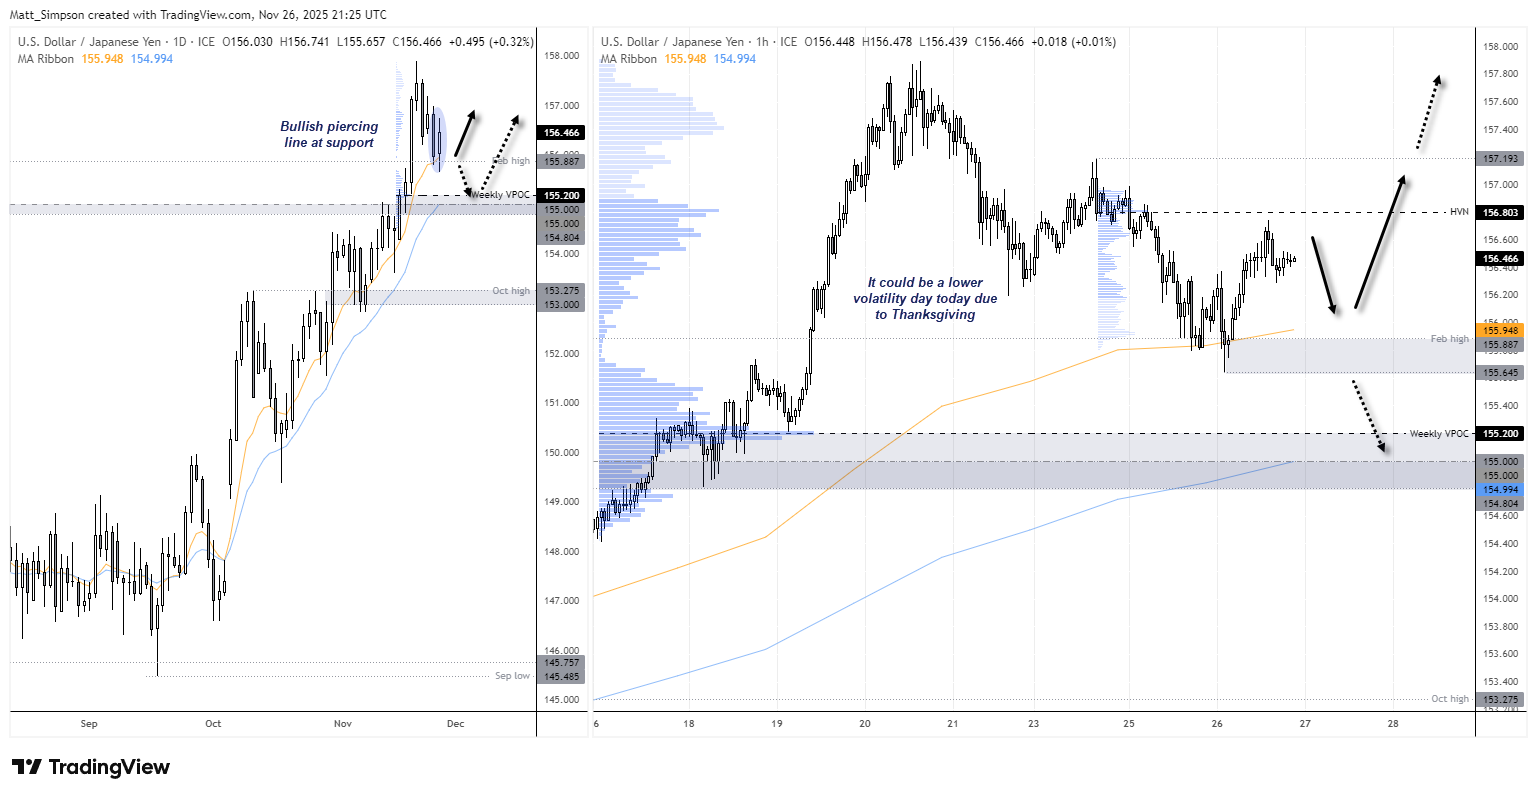
Chart analysis by Matt Simpson - data source: TradingView USD/JPY

Nikkei 225 Futures (NK) Technical Analysis
The correlation between the Nikkei and the Japanese yen is not as strong as it once was, with the 10-day correlation slipping to 0.08 — effectively non-existent. However, the 20-day correlation between the Nikkei and USD/JPY remains a healthy 0.81, showing their medium-term trends still tend to track one another.
The daily chart shows Nikkei futures have risen to a four-day high, although the low volumes warn of a potential false move. Price action also looks hesitant around the 50,000 level.
Patience may be required. Ideally, I’d like to see a retracement within the prior two-day range and a higher low form on the lower timeframes. That would give bulls a cleaner setup to buy dips in anticipation of a sustained break above 50k, perhaps next week — assuming prices continue to hold above the November low.

Chart analysis by Matt Simpson - Source: TradingView, Nikkei Futures (NKD1!)
View the full economic calendar
-- Written by Matt Simpson
Follow Matt on Twitter @cLeverEdge
How to trade with City Index
You can trade with City Index by following these four easy steps:
- Open an account, or log in if you’re already a customer
• Open an account in the UK
• Open an account in Australia
• Open an account in Singapore
- Search for the market you want to trade in our award-winning platform
- Choose your position and size, and your stop and limit levels
- Place the trade